 simmis
Stuttgart in a posterior: a city simulation you can question
IDEAS FOR THE FUTURE SIMMIS. These articles connect implemented research foundations to longer term product direction. They do not describe universal behaviour in the current Simmis product.
What would happen to Stuttgart’s shops if the Milaneo shopping centre near the main station closed? What if the same floor space stood in Zuffenhausen instead? A simulation of the whole city, fitted to published data, answers with its uncertainty attached. If the Milaneo closed, about half of the 93 M€ a year that residents spend there would move to other shops in Mitte. A centre of the same size in Zuffenhausen would capture 59 % of that money, somewhere between 27 and 97 M€. This article describes the research demonstrator behind those numbers, and you can open the explorer and follow along. The model is a prototype, and its numbers are results under stated assumptions, not forecasts.
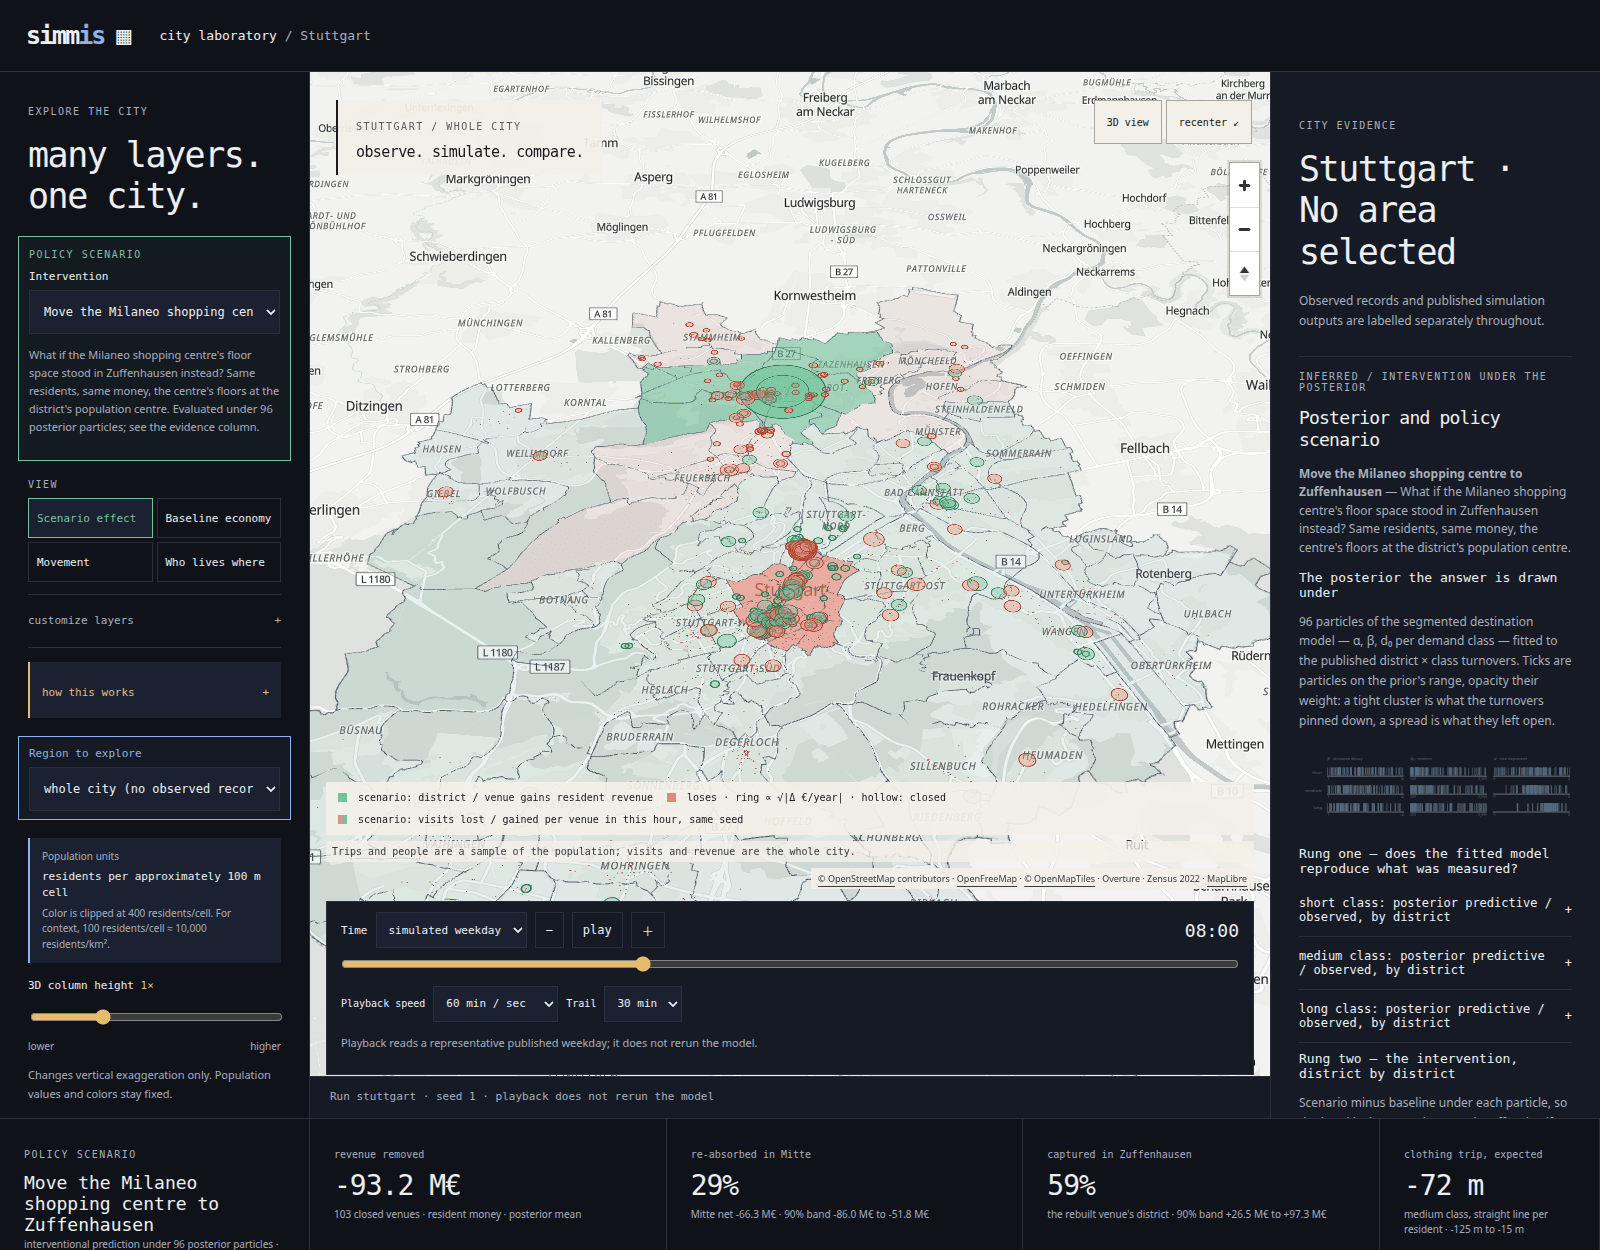
A city is a good test for a simulation because everyone has intuitions about it and some of those intuitions are measured. Stuttgart publishes how many people live in every 100 m square, how much floor space its shops have, and how much they sell by district and by kind of goods. A model that claims to explain the city’s retail has to reproduce those numbers, and where it cannot, the gap is information.
The demonstrator is built so that three things can be checked. Its inputs are measured, and each names its source. Its parameters are inferred from published figures, with the uncertainty those figures leave. A policy question is an explicit intervention on the model, evaluated with the same random draws as the baseline. The next three sections take them in turn.
A weekday for 936,597 people
The simulation builds a synthetic Stuttgart from published data. Residents are drawn cell by cell from the Zensus 2022 grid and in-commuters from the employment agency’s commuter statistics. The 3,637 shops come from Overture Maps and OpenStreetMap, with floor areas taken from building footprints and scaled to the city’s retail survey. The model page lists every input with its source.
Each person then lives a weekday from an activity diary that says when they leave home, go to work, shop or eat. German diary microdata is available only through a research data centre, so the diaries come from the Statistics Canada Time Use Survey 2022, reweighted to Stuttgart’s measured trip rate. That transfer is the model’s largest assumption.
When a diary says shop, the person picks a shop. The choice follows Huff’s gravity model, in which a shop’s pull grows with its floor area and falls with distance:
Here j is a shop, c the 100 m cell the person is in, Aj the shop’s floor area and dcj the distance between them. The exponent α sets how much size matters, β how quickly distance puts people off, and d0 the radius within which distance hardly matters. The probabilities are normalised over all 3,637 shops. Nobody in this model optimises over the city. People weigh size against distance, which is bounded rationality in Herbert Simon’s sense, and the data have to decide how.
Shopping comes in three demand classes, because one kernel cannot fit Stuttgart: a kernel flat enough to fill the centre with clothing turnover makes grocery trips implausibly long. Food and daily needs, clothing and shoes, and long-lived goods such as furniture each get their own α, β and d0, their own share of every household’s purchasing power, and their own floor area per shop. That makes nine numbers.
Each shopping trip is decided once: its class, whether the purchase leaves the city, and the shop. The trips drawn on the map, the visits counted at each shop and the money those visits carry all come from that one decision, so the explorer shows a single simulated day rather than separate layers that merely agree on average.
Nine numbers the data has to decide
The city’s retail concept publishes turnover for each of 23 districts in each of the three classes, 69 observations in all. The model predicts the same 69 numbers by sending every resident’s spending through the choice kernel and summing where it lands. The prediction is an exact expectation rather than a sampled day, so it carries no Monte Carlo noise, and a likelihood compares it with the published values on a log scale.
Inference asks which values of the nine numbers make the published turnover plausible. The answer is a posterior distribution, a set of possible cities rather than one best fit, which the Bayesian inference article illustrates. Here it is computed with Spindel, the probabilistic programming runtime of the replikativ stack, as two independent runs of 48 Metropolis–Hastings chains, each of which runs the whole-city simulator at every step. The likelihood is evaluated on a GPU in about half a second per step, so a chain can take 200 steps in an hour. Started from different random points, the two runs end in the same distribution for every parameter. That checks where the chains end rather than how well each one explored, so it is a necessary test of convergence, not a proof.
The figure shows what district totals can and cannot decide. They fix how strongly floor area attracts spending on long-lived goods. They leave the distance decay close to where the prior put it, because a steeper decay with a wider flat zone near home produces much the same district totals as a shallower one.
That points to what would sharpen the model. Measured shopping trip distances, such as those in the Mobilität in Deutschland survey, would constrain the distance decay directly. Visit counts per shop, anonymised card spending or pedestrian counts at a few dozen points would each separate kernels that district totals cannot. A simulation with an explicit likelihood can say which measurement would be worth collecting before anyone collects it.
Closing a shopping centre on paper
A policy question is an intervention. In the terms of the causal graph article, closing the Milaneo sets the venue set to a new value, do(venues := venues without the Milaneo), cuts nothing upstream, and recomputes every choice downstream. The residents and their money stay the same.
The simulator evaluates the change under every one of the 96 posterior draws and reports the difference per draw, so the spread is the uncertainty about the effect itself rather than two uncertainties added together. For the Milaneo, whose 103 shops within 170 m of Mailänder Platz hold about 24,000 m² of floor space:
- Closing it removes about 93 M€ a year of resident spending from those shops. About half is spent elsewhere in Mitte and half in other districts. Mitte’s net loss is 47 M€, with a 90 % band from 35 to 62 M€. The expected straight-line trip for clothing gets 27 m shorter, because the centre had been pulling people past nearer shops.
- Moving the same floor space to Zuffenhausen’s population centre captures about 59 % of that money there, 55 M€ with a band from 27 to 97 M€, and Mitte keeps 29 %.
The width of the Zuffenhausen band is the honest part of that answer. How much a large new centre would draw depends on exactly the parameters the district totals leave open, above all how steeply distance deters shoppers.
These are results of the model, and the model lacks things that would change them. It has no agglomeration: a centre on Königstraße benefits from the shops around it, and a box in Zuffenhausen would not. Only resident money moves in the scenario, while commuters and visitors keep spending where the baseline put them. Prices, opening hours and the competitors’ response are fixed. Read the Zuffenhausen figure as the capture a pure size-and-distance model allows, an upper bound on the pull of floor space alone.
Because every random draw in the simulator is a pure function of a seed, a person and a purpose, the same weekday can also be replayed under the changed venue set with the same draws for every person. The explorer’s visit-change layer shows that paired day hour by hour. It is not a minimal counterfactual: removing one shop shifts the choice intervals of others, so some people whose shop stayed open move too.
What the model cannot tell you
A simulation earns trust by being clear about where it stops. For this one:
- Transferred behaviour. Daily rhythms come from urban Canada. Only the trip rate is Stuttgart’s.
- Assumed shares. How shopping trips split between the three classes is a placeholder (65 %, 20 %, 15 %), and so is how leakage and commuter spending are attributed.
- A static economy. Shops do not open, close or change prices in response. There is one representative weekday.
- A posterior fitted to 69 district totals, which leave the distance decay close to its prior.
The model page lists every input as measured, assumed or fitted, and every derived data file carries a receipt naming its source. That table is the part of the project most worth arguing with.
Why build it this way
The interesting object here is not the Milaneo number. It is a model whose assumptions sit in one place, whose parameters are fitted to named evidence, and whose answer to a policy question comes with the spread the evidence leaves. Such a model can be disagreed with productively. Someone who thinks the centre has agglomeration effects can add them on a branch, refit, and compare. Someone with pedestrian counts can add an observation and see which parameters it narrows. That is the shared modelling practice we are interested in, for businesses asking what-if questions of their own operations, for city administrations and residents discussing a plan, and for language model agents that collect data, propose model changes and run the checks.
Later articles in this series will take the pieces apart: how the simulator runs and why one decision serves every layer, what the data can decide and which measurement would help most, how the evidence behind each input is kept, and how agents can take part in the work.
Try it and read further
- The explorer: the two scenarios, the posterior, and the calibration against every published turnover.
- The model: every equation, the full causal graph and the measured, assumed and fitted table.
- The code: replikativ/city-rstr, a research prototype rather than a library. The simulator and the explorer are written in Clojure, on Spindel for inference, raster for the kernels that also run on a GPU, and Datahike for the evidence store.
Data: Zensus 2022 (© Statistisches Bundesamt), Landeshauptstadt Stuttgart (retail concept 2024, district boundaries), Statistik der Bundesagentur für Arbeit, Statistics Canada Time Use Survey 2022, Mobilität in Deutschland, © OpenStreetMap contributors, Overture Maps Foundation.
See how Simmis lets teams delegate consequential work without losing control of what becomes official.